In March 2020, lockdown measures were implemented all over the world due to the spread of Covid-19. I was at home, a bit bored and I was looking for something to do.
TL;DR: - Kaggle submission - Github repo
Mobility datasets
Google and Apple published datasets related to (anonymized) activity of smartphones users. They called this mobility data, although this doesn’t show trajectories but rather the frequentation of some categories of places, such as grocery stores, residential or workplaces.
At first, there were no csv files, only pdf graphs that did not show raw data. I found a reddit post that extracted some of the data from the reports (for US regions), and I extended it to make it work with worlwide data. I then published it on a small website I made for the occasion.
The code to do the download + parsing + extraction is available on a github repo
Uncover challenge
The Uncover challenge appeared on Kaggle a few days afterwards. From the description:
The Roche Data Science Coalition (RDSC) is requesting the collaborative effort of the AI community to fight COVID-19. This challenge presents a curated collection of datasets from 20 global sources and asks you to model solutions to key questions that were developed and evaluated by a global frontline of healthcare providers, hospitals, suppliers, and policy makers.
The task that immediately caught my attention:
How is the implementation of existing strategies affecting the rates of COVID-19 infection?
I had a (not so secret) weapon: mobility data.
Exploration
First I did some exploration and dataviz leveraging the ACAPS dataset, Google mobility data and epidemiology data (number of cases, deaths etc.).
I exported a jupyter notebook to html, and since I leveraged Altair based on Vega-lite, the data is embedded in the js so it works without a server.
Compartmental models
Then I found this Kaggle notebook by @anjum48 (Datasaurus), published in the Covid forecasting competition (another Kaggle competition). I like the scientific approach: based on well-known Compartmental models in epidemiology, he extends it to fit the Covid-19 situation.
Recruiting the team
After this preliminary work, I reach out to two friends for a collaboration: a data scientist and a quant analyst. They were also motivated by the project ! So we went to work on the challenge with this special forces team.
Probabilistic programming
I had heard about bayesian inference before, but did not know how it worked. We decided to explore this path. As a first step, we chose a framework. We went for the young an promising Numpyro, based on JAX and made by some of the (very skilled) Pyro authors. This is also how I discovered JAX.
An example in particular seemed to fit our problem: a prey-predator differential equations model.
Imperial College in London had already started to publish a series of papers called the Covid-19 reports. Report 13 was particularly relevant for our challenge, and can be found here.
Collaborating on a Jupyter notebook
Kaggle required a notebook submission. Collaboration on notebook is particularly challenging: indeed, the JSON format that mixes code and data is not git-friendly. So, I developed a small ipython magic command that allows us to modify code inside a notebook cell, and when executed it saves it into a specific file. The notebook wasn’t version-controlled, but every cell snippet was. It wasn’t ideal, since the imports were not included in every cell.
The submission
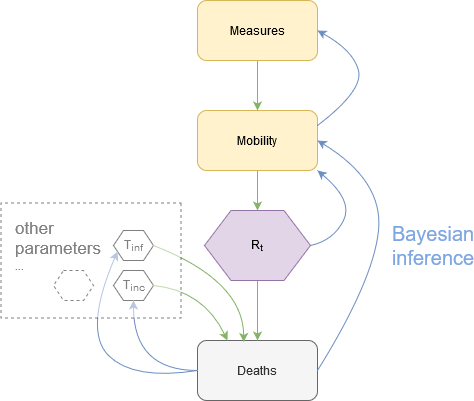
In fine, we implemented bayesian Covid-19 models that perform:
- An estimation of the effective reproduction number R_t as a function of mobility data and reported deaths
- An estimation of mobility as a function of non-pharmaceutical interventions
See the kaggle submission for the full analysis.
The Roche team accepted our submission, so we won the challenge for this particular task.
Reuse
Citation
@online{guy2021,
  author = {Guy, Horace},
  title = {Bayesian Epidemiology},
  date = {2021-09-09},
  url = {https://blog.horaceg.xyz/posts/uncover-covid/},
  langid = {en}
}